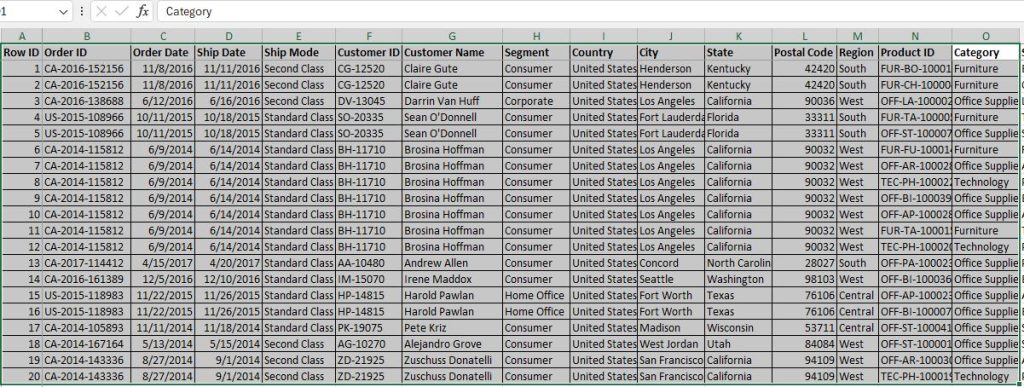
Transforming data into actionable insights is one of the goals of every passionate Data Analyst. In today’s project, we will be looking at the transformation of the data contained in the screenshot below into actionable insights using the Power BI tool.
The dataset used for this Analysis/Dashboard is known as the Super Store Data. Below is a screenshot of the first 20 rows and 15 columns; but the entire dataset has a total of 9995 rows and 21 columns.
Why Use of Power BI: Power BI offers a compelling set of features to streamline your workflow; it excels at data visualization. With a wide range of charts and graphs, you can present complex information in an easily digestible way. This allows you to uncover trends, identify patterns, and communicate your findings to both technical and non-technical audiences effectively.
Beyond visualization, Power BI empowers you with self-service data analysis. Power BI connects to a vast array of data sources, enabling you to work with information from various departments and applications. Power BI’s intuitive interface makes data cleaning, transformation, and model creation accessible, letting you focus on extracting insights from your data.
Join me on producing the Super Store’s Sales Dashboard using the Power BI tool.
Watch the video below to see the interactive dashboard in display.